More than 10 devices on NordVPN: share the connection
 Tõnis6 min read
Introduction
NordVPN lets you connect ten devices at once. If you use it on a laptop and a phone, that's probably enough. When you also run apps on servers, giving each one its own VPN connection starts to use up that allowance.
I share the connections instead. One server connects to NordVPN, and my apps send their web traffic through it. Another app can use that same connection without signing in to NordVPN separately.
I use this for my Mac browser and the browsers that collect information for my projects. I also built a dashboard because I wanted to see which apps were using each connection and how much traffic they sent. This is the setup, and how to do something similar yourself.
One VPN connection, several apps
The server in the middle runs a proxy: it accepts web requests from an app, forwards them through its VPN connection, and sends the responses back. The app needs the proxy's address and login details. It doesn't need its own VPN installation.
NordVPN documents the same sharing principle for routers. A router uses one device slot, even when several devices behind it use the VPN. My setup applies that idea to individual apps, including apps running on different machines.
The connection limit still applies to the servers that connect to NordVPN. Adding another client to an existing proxy reuses its connection. Adding a separate VPN connection for another country uses another slot.
Only the apps configured to use the proxy send traffic through it. If you want everything on your home Wi-Fi to use the VPN, start with NordVPN's router setup.
What my setup looks like
I have shared NordVPN connections in Los Angeles, New York, Singapore, Finland and Estonia. Each runs Gluetun, which maintains the VPN connection and provides a proxy for the apps using it. I added New York and Singapore on November 7.
The screenshot below is my dashboard. Read it from left to right: an app, the connection it uses, the way that connection reaches the internet, and the location seen by an external check.
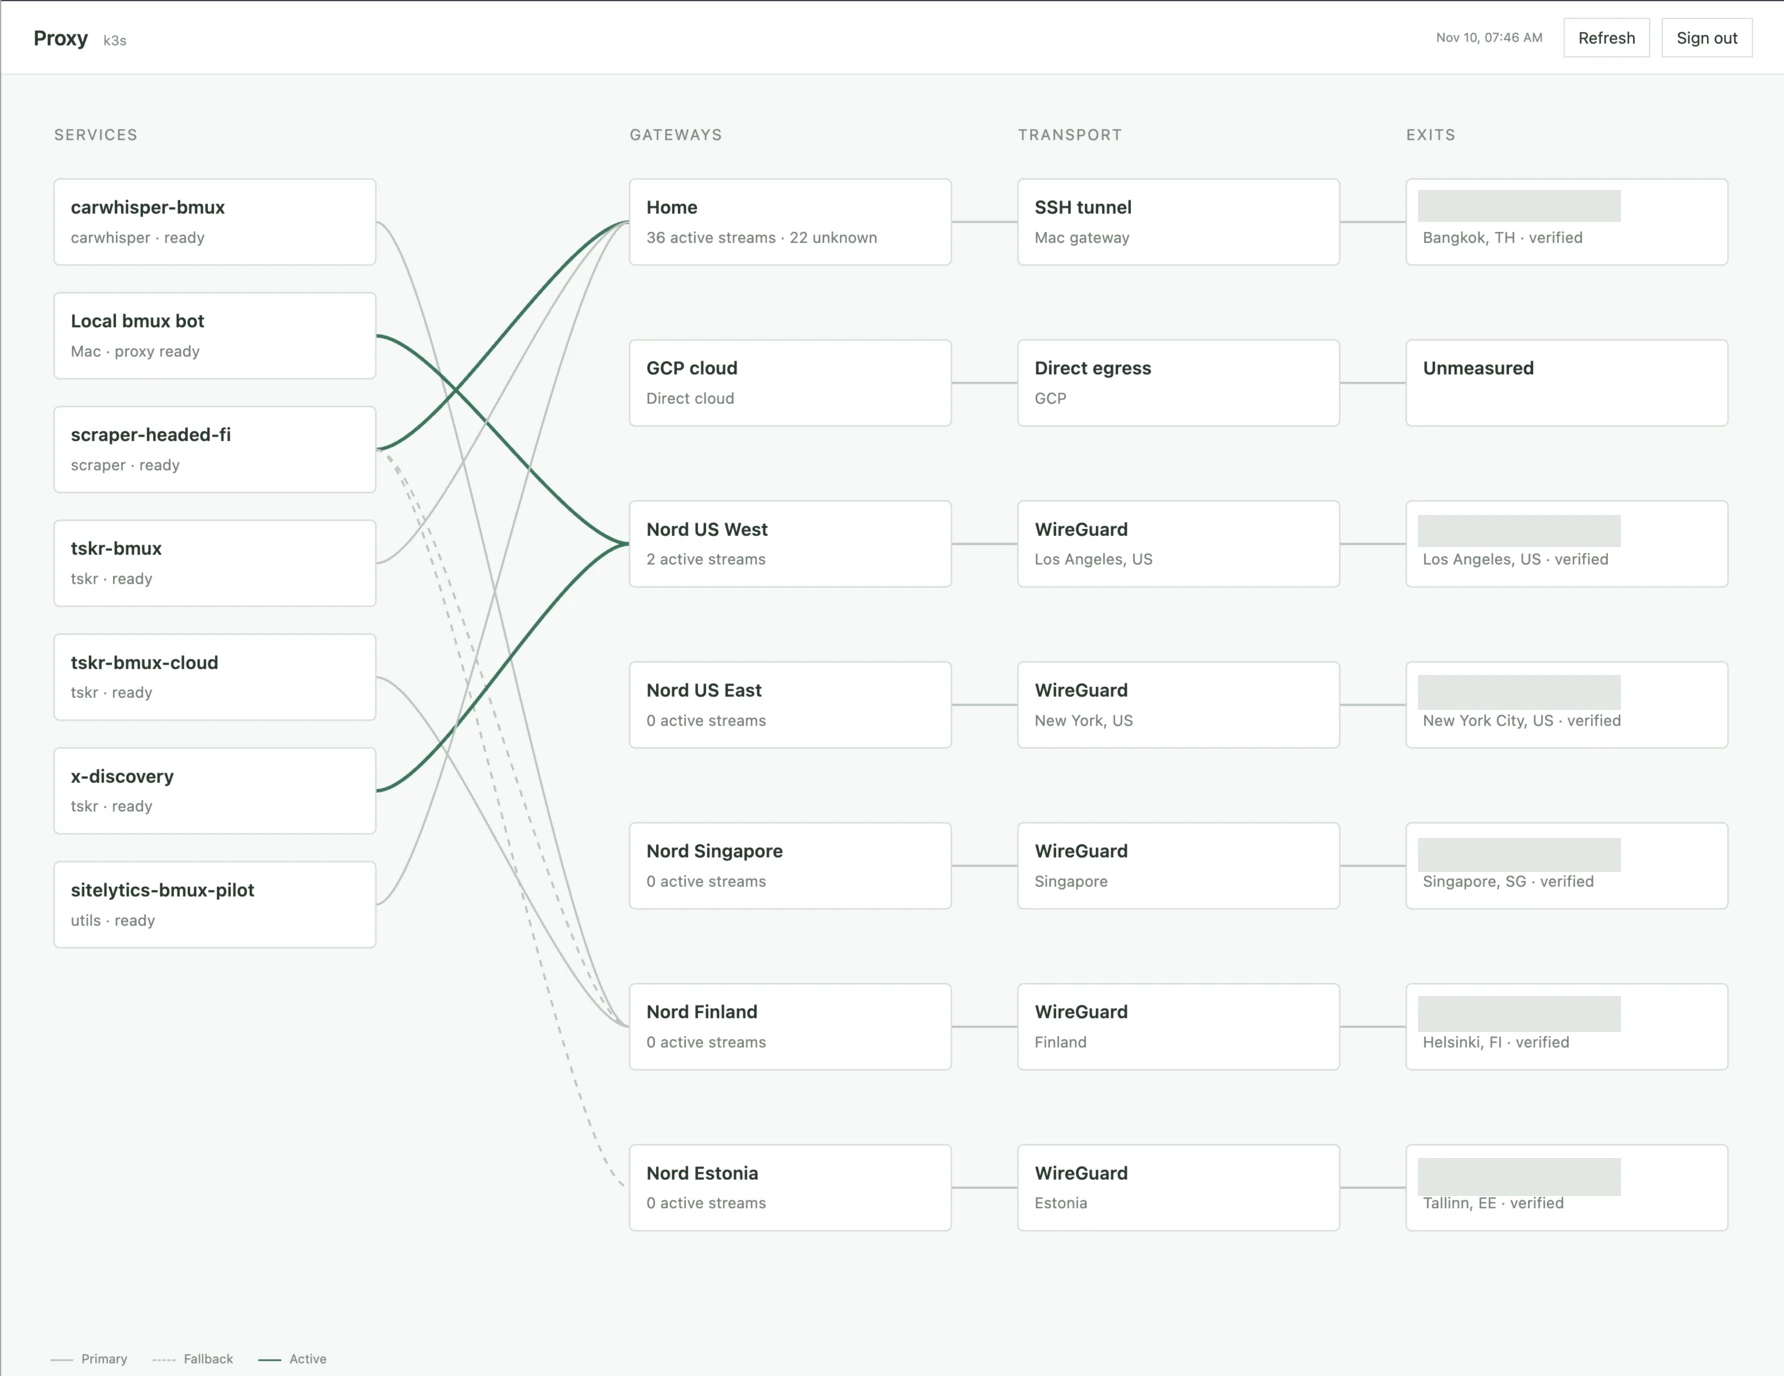
Follow the green line from Local bmux bot to Nord US West, then across to Los Angeles. That's my Mac browser sending traffic through the shared US connection. The x-discovery app joins the same gateway. It doesn't need a second US VPN connection.
bmux is the browser I use for agent-driven browsing. Some copies run on my servers to collect information for projects such as Trend Seeker. Those are the apps with names like tskr-bmux in the screenshot. They are ordinary browsers controlled by software.
Other apps use my home connection, with regional VPNs available as fallbacks. Putting these routes on one screen makes it easier to see which apps share a connection. At the time of the screenshot, New York and Singapore had no active streams. Having a region available doesn't mean an app is using it.
Connecting my Mac browser
My Mac reaches the US gateway through an authenticated HTTPS proxy. That lets it use the same VPN connection as the server apps. The browser connects to a proxy endpoint; my dashboard is a separate app for inspecting those connections.
In bmux, I open the profile's Connection settings, choose Custom, and enter the proxy protocol, host, port and credentials. My remote connection uses HTTPS on port 443.
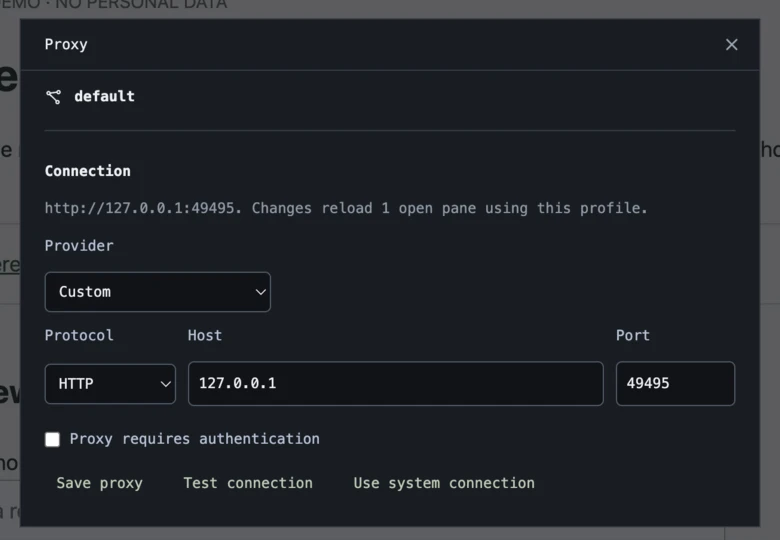
I test the connection before using it. If I'm connecting through the US West gateway, I expect the exit check to come back from Los Angeles.
There's one bmux detail worth checking: saving a default with Use for new panes affects new panes. Existing panes keep their saved connections, including after a restart. Changing the default alone won't move every open page. The current profile guide explains how saved connections work.
Another device can use the same approach if its browser or app supports an authenticated proxy. Connect it to the existing endpoint and check its exit location too.
Trying it yourself
You can start with one machine and one VPN region. You don't need my dashboard or five countries to share a connection.
- Set up Gluetun with your VPN provider's credentials and check that it connects successfully.
- Enable its HTTP proxy with
HTTPPROXY=on. Gluetun's default listener is port 8888; its proxy documentation lists the address and authentication settings. - Configure a browser to use that proxy. For a trusted local network, follow Gluetun's LAN client guide. For remote clients, provide an authenticated TLS entry point, as I do for my Mac.
- Check the public exit location from that browser. Also test that requests fail when the VPN connection is unavailable, rather than falling back to the server's ordinary internet connection.
After that works, point another app at the same proxy. Both can reuse the existing VPN connection. The shared server now matters to both apps, so an outage there affects both too.
Seeing where the traffic goes
Sharing connections also gives me a place to count traffic. Each gateway measures open connections, transferred bytes and failures. The dashboard groups that traffic by app where it can identify the source. It keeps traffic it can't attribute in an unknown category.
I can look at an old proxy and ask whether any apps still reference it or send traffic through it. During this migration, the old cloud proxy ended up without configured consumers. That's the kind of information I want before deciding whether to keep paying for infrastructure.
For API costs, these counters are a starting point. They show which services send traffic, but bytes don't tell me how many billable tokens or requests an API charged for. I'd need provider usage records and prices to calculate that bill. The dashboard currently observes traffic; it doesn't enforce a spending limit.
The counters reset when their relay restarts, so I use them for investigating current activity rather than monthly accounting.
FAQ
Does this let more than ten devices use NordVPN?
Several apps on different devices can reuse one server's VPN connection through its proxy. NordVPN's connection limit still applies to the VPN connections themselves. Each additional regional tunnel uses another slot.
Will every app on my device use the VPN?
Only apps configured to use the proxy send traffic through it. For all devices on a home network, NordVPN's router setup is a better starting point. My setup lets me choose a route for each app.
Do I need the dashboard to share a connection?
No. Start with one Gluetun instance, enable its HTTP proxy and connect a browser. Check the exit location from that browser before adding more clients. The dashboard helps me inspect the routes and traffic once several apps share them.
Why did my existing bmux tabs keep their old connection?
The default saved with Use for new panes applies to new panes. Existing panes retain their saved connection, even after a restart. Check the connection used by the pane you're testing; changing the default won't move it.
Can the traffic counters tell me my API bill?
They show transferred bytes, open connections and failures. Calculating API costs also needs the provider's billable usage and prices. My counters reset when the relay restarts, and the dashboard doesn't enforce a spending cap.